Diagnosing System Issues in Linux
Linux provides powerful tools to monitor and troubleshoot system performance. If a process is consuming too much CPU, memory, disk I/O, or network bandwidth, you can use these commands:
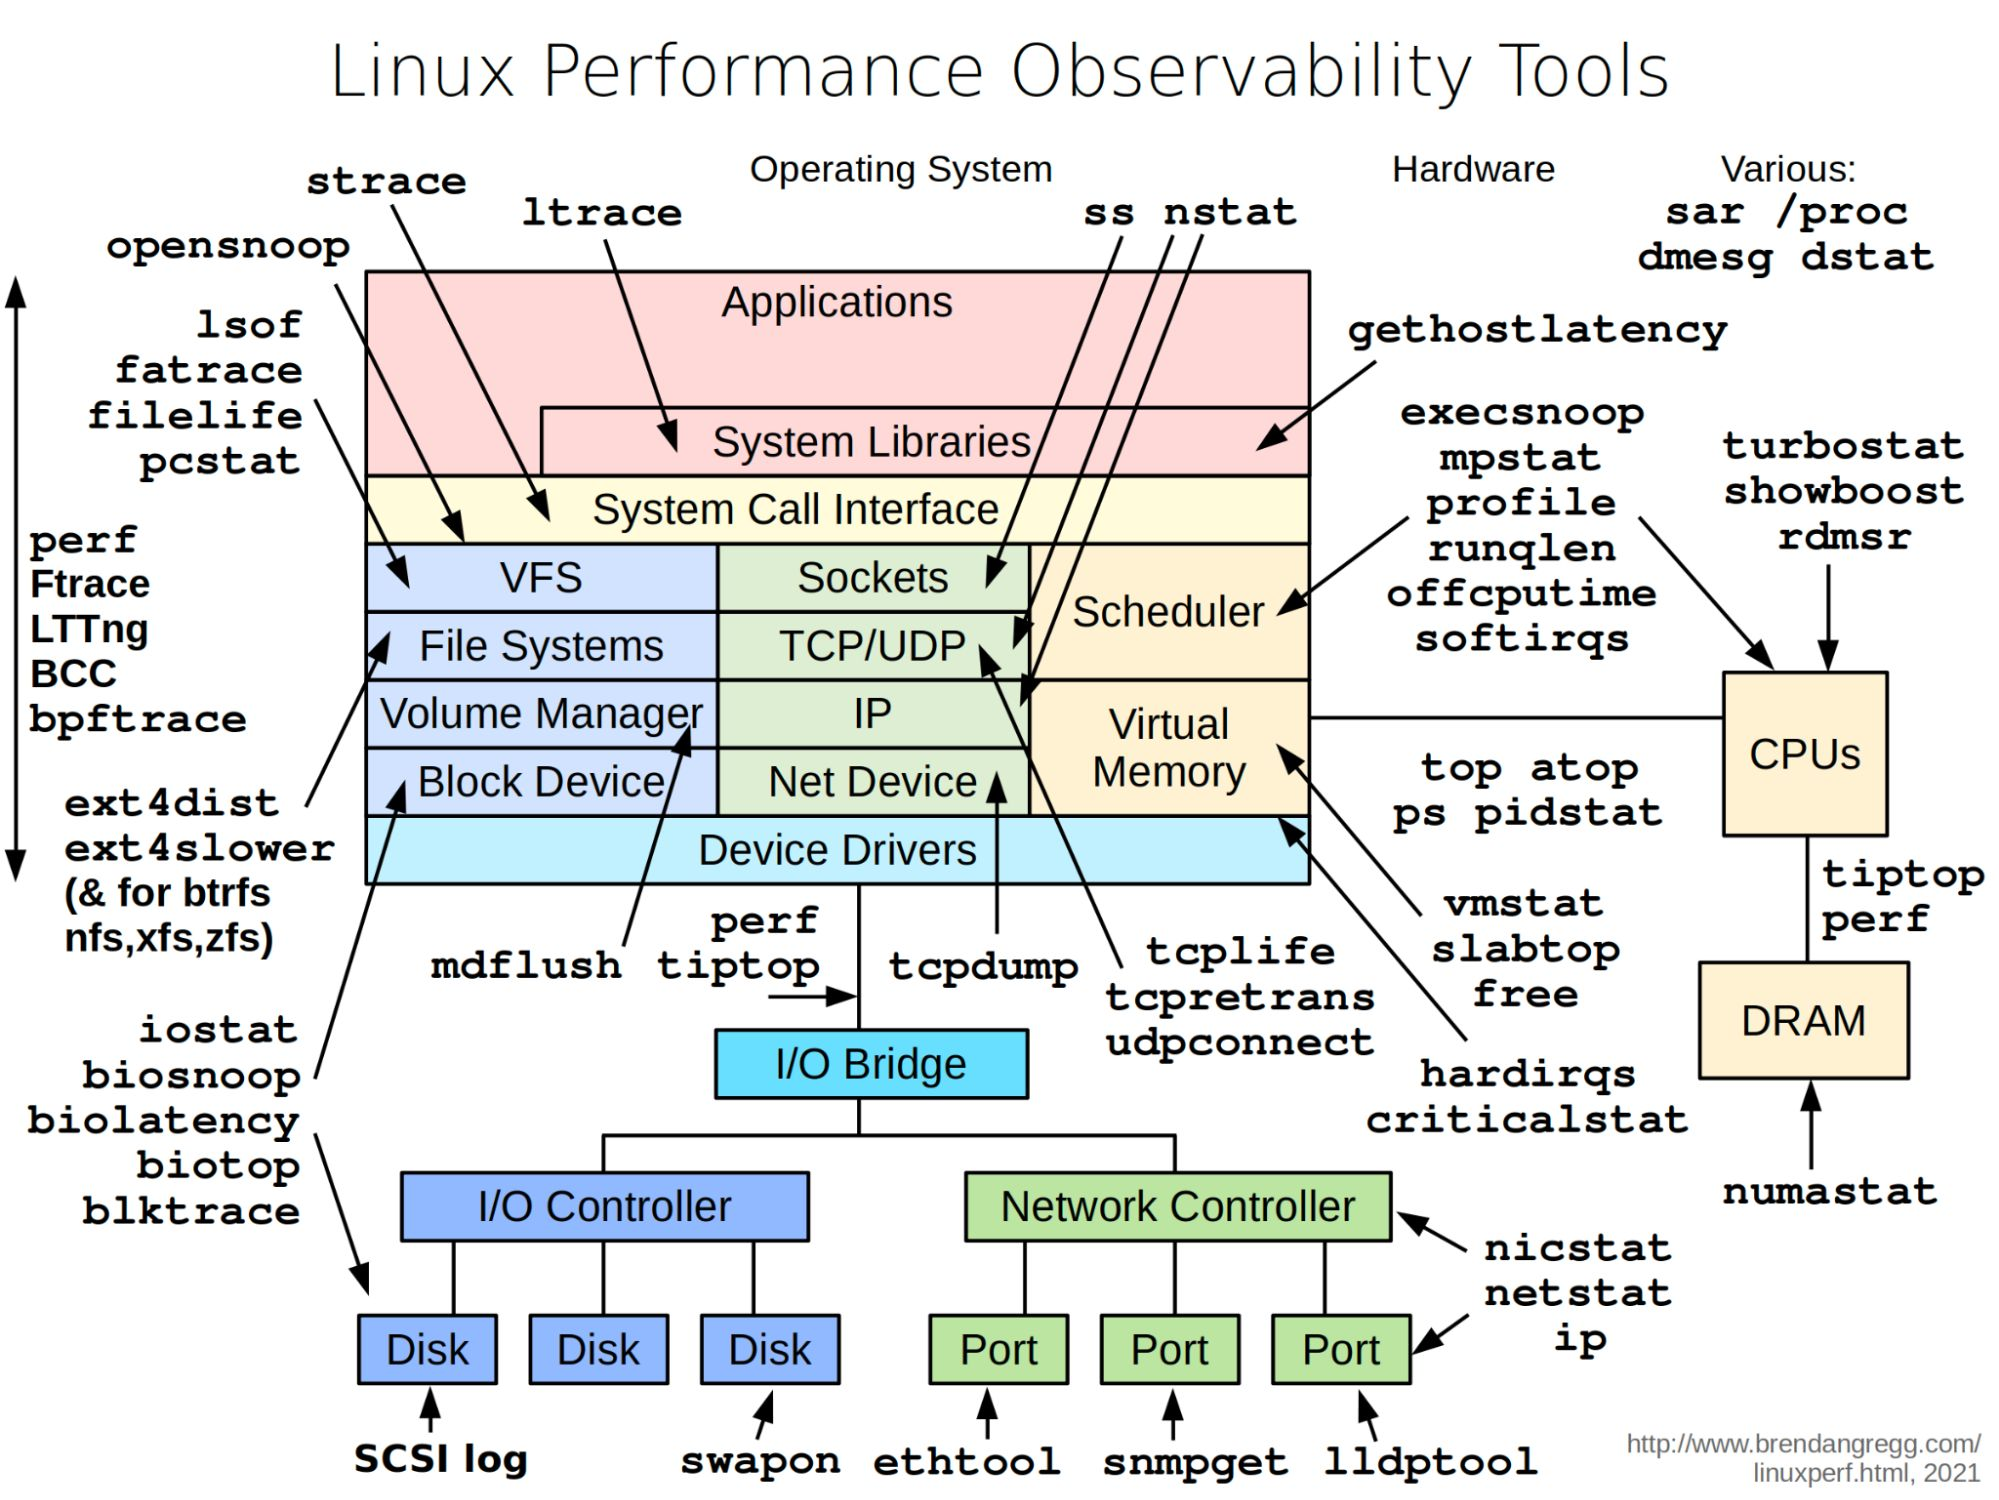
Common Linux Observability Tools
CPU & Memory
top,atop,ps,pidstat: Monitor running processes and their resource usage.vmstat: Reports on processes, memory, paging, block I/O, traps, and CPU activity.mpstat,sar,dstat,slabtop,free: Show CPU and memory statistics.turbostat,showboost,rdmsr: Advanced CPU performance and power analysis.numastat: NUMA memory statistics.criticalstat,hardiqrs,softirqs: Interrupt and critical event statistics.
Disk & I/O
iostat: CPU and input/output statistics for devices.biosnoop,biolatency,biotop,blktrace: Disk I/O tracing and latency analysis.mdflush: Monitor disk flush operations.SCSI log: View SCSI disk logs.swapon: Show swap device usage.
File Systems & Block Devices
lsof: List open files.filelife,pcstat: File access and life statistics.ext4dist,ext4slower: ext4 filesystem latency and distribution (also for btrfs, nfs, xfs, zfs).perf,Ftrace,bcc,bpftool,bpftace,LTTng: Kernel and system tracing.
Network
netstat,ss,ip,nicstat: Network statistics and interface info.tcpdump,tcplife,tcpretrans,udpconnect: Packet capture and TCP/UDP connection analysis.nstat: Network statistics.ethool,snmpget,lldptool: Network device and protocol diagnostics.
System Calls & Applications
strace,ltrace,opensnoop: Trace system and library calls made by applications.gethostlatency,execsnoop,profile,runqlen,offcputime: Application and system call latency and profiling.
Various & System Info
/proc: Access kernel and process information.dmesg: View kernel and driver messages.ss: Socket statistics.showboost: CPU boost status.perf,tiptop: Performance analysis.
These tools help you pinpoint performance bottlenecks, analyze resource usage, and troubleshoot issues across the entire Linux system—from hardware to applications.